Geometries and Vector Data Cubes with xvec.GeometryIndex#
See also
Learn more at the xvec documentation.
Highlights#
Xvec’s use of custom indexes is exciting because it illustrates how a new Index can help define a new data model — vector data cube: “an n-D array that has either at least one dimension indexed by a 1-D array of vector geometries”.
Indexing using geometries and associated predicates is supported using
.selA new
.xvecaccessor exposes additional querying functionality.Exposes complex functionality from other full-featured packages (e.g. shapely) to Xarray.
Example#
First we create a data cube with geometries
Show code cell source
Hide code cell source
import geopandas as gpd
from geodatasets import get_path
import shapely
import xarray as xr
import xvec

xr.set_options(display_expand_indexes=True, display_expand_data=False, display_expand_attrs=False)

counties = gpd.read_file(get_path("geoda.natregimes"))

cube = xr.Dataset(
    data_vars=dict(
        population=(["county", "year"], counties[["PO60", "PO70", "PO80", "PO90"]]),
        unemployment=(["county", "year"], counties[["UE60", "UE70", "UE80", "UE90"]]),
        divorce=(["county", "year"], counties[["DV60", "DV70", "DV80", "DV90"]]),
        age=(["county", "year"], counties[["MA60", "MA70", "MA80", "MA90"]]),
    ),
    coords=dict(county=counties.geometry, year=[1960, 1970, 1980, 1990]),
)
cube
Downloading file 'natregimes.zip' from 'https://geodacenter.github.io/data-and-lab//data/natregimes.zip' to '/home/docs/.cache/geodatasets'.
<xarray.Dataset> Size: 370kB
Dimensions:       (county: 3085, year: 4)
Coordinates:
  * county        (county) geometry 25kB POLYGON ((-95.34258270263672 48.5467...
  * year          (year) int64 32B 1960 1970 1980 1990
Data variables:
    population    (county, year) int32 49kB 4304 3987 3764 ... 43766 55800 65077
    unemployment  (county, year) float64 99kB 7.9 9.0 5.903 ... 7.018 5.489
    divorce       (county, year) float64 99kB 1.859 2.62 3.747 ... 4.782 7.415
age (county, year) float64 99kB 28.8 30.5 34.5 ... 28.97 35.33- county: 3085
- year: 4
- county(county)geometryPOLYGON ((-95.34258270263672 48....
<GeometryArray>
[<POLYGON ((-95.343 48.547, -95.341 48.715, -95.094 48.717, -95.095 48.912, -...>,
 <POLYGON ((-118.851 47.95, -118.847 48.478, -118.869 48.479, -118.87 48.647,...>,
 <POLYGON ((-117.438 48.044, -117.541 48.043, -117.536 47.79, -117.607 47.798...>,
 <POLYGON ((-118.971 47.939, -118.973 47.96, -118.953 47.989, -118.953 48.02,...>,
 <POLYGON ((-117.438 49, -117.031 49, -117.028 48.838, -117.038 48.046, -117....>,
 <POLYGON ((-117.028 48.838, -117.031 49, -116.062 49, -116.056 48.499, -116....>,
 <POLYGON ((-116.054 48.209, -116.056 48.499, -116.062 49, -114.728 49, -114....>,
 <POLYGON ((-113.473 47.598, -113.636 47.6, -113.628 47.652, -113.602 47.669,...>,
 <POLYGON ((-112.182 48.471, -112.228 48.479, -112.583 48.475, -112.587 48.3,...>,
 <POLYGON ((-111.421 48.218, -111.673 48.213, -111.673 48.337, -111.799 48.33...>,
 ...
 <POLYGON ((-76.922 36.554, -76.924 36.554, -77.177 36.556, -77.32 36.554, -7...>,
 <POLYGON ((-79.144 36.546, -79.217 36.55, -79.1 37.056, -79.037 37.03, -79.0...>,
 <POLYGON ((-79.438 37.616, -79.458 37.603, -79.444 37.57, -79.467 37.552, -7...>,
 <POLYGON ((-80.125 37.125, -80.14 37.128, -80.154 37.114, -80.168 37.112, -8...>,
 <POLYGON ((-87.748 44.962, -87.84 44.927, -87.831 44.873, -87.986 44.72, -87...>,
 <POLYGON ((-114.52 33.028, -114.558 33.037, -114.609 33.027, -114.633 33.034...>,
 <POLYGON ((-107.195 34.584, -107.718 34.584, -108.227 34.583, -109.048 34.59...>,
 <POLYGON ((-76.396 37.108, -76.403 37.091, -76.434 37.089, -76.464 37.103, -...>,
 <POLYGON ((-77.532 38.565, -77.721 38.84, -77.707 38.877, -77.678 38.885, -7...>,
 <POLYGON ((-111.372 44.745, -111.368 45.35, -111.349 45.349, -111.349 45.635...>]
Length: 3085, dtype: geometry
- year(year)int641960 1970 1980 1990
array([1960, 1970, 1980, 1990])
- population(county, year)int324304 3987 3764 ... 55800 65077
array([[ 4304, 3987, 3764, 4076], [ 3889, 3655, 5811, 6295], [ 17884, 17405, 28979, 30948], ..., [ 21583, 33203, 44189, 53427], [ 50164, 111102, 166665, 250377], [ 39260, 43766, 55800, 65077]], shape=(3085, 4), dtype=int32) - unemployment(county, year)float647.9 9.0 5.903 ... 5.444 7.018 5.489
array([[ 7.9 , 9. , 5.9025788 , 3.89479009], [ 8.2 , 15.4 , 15.42288557, 16.8115942 ], [10.1 , 9. , 13.57406431, 10.70079408], ..., [ 2.5 , 3.10506508, 5.03704493, 4.1028878 ], [ 3.3 , 2.36155862, 3.70888552, 3.35398107], [ 5.21803859, 5.44429066, 7.01794317, 5.48855304]], shape=(3085, 4)) - divorce(county, year)float641.859 2.62 3.747 ... 4.782 7.415
array([[ 1.85897436, 2.61980831, 3.74659401, 7.38853503], [ 2.86327845, 3.68600683, 6.6254417 , 11.54313487], [ 2.71144662, 2.97637795, 5.44822257, 9.12321222], ..., [ 1.11322292, 1.55032333, 3.25763881, 4.85074627], [ 1.67239146, 1.46834319, 3.74220727, 5.75017712], [ 2.77758585, 2.72460364, 4.78226375, 7.4145588 ]], shape=(3085, 4)) - age(county, year)float6428.8 30.5 34.5 ... 26.4 28.97 35.33
array([[28.8       , 30.5       , 34.5       , 35.5       ],
       [25.9       , 27.1       , 27.2       , 32.8       ],
       [29.6       , 31.8       , 28.7       , 34.5       ],
       ...,
       [24.4       , 24.4       , 29.8       , 34.        ],
       [22.3       , 21.8       , 25.66666667, 28.46666667],
       [28.25      , 26.4       , 28.96666667, 35.33333333]],
      shape=(3085, 4))
Note how the county dimension is associated with a geopandas.GeometryArray.
Assigning#
Now we can assign an xvec.GeometryIndex to county.
cube = cube.xvec.set_geom_indexes("county")
cube
<xarray.Dataset> Size: 370kB
Dimensions:       (county: 3085, year: 4)
Coordinates:
  * county        (county) geometry 25kB POLYGON ((-95.34258270263672 48.5467...
  * year          (year) int64 32B 1960 1970 1980 1990
Data variables:
    population    (county, year) int32 49kB 4304 3987 3764 ... 43766 55800 65077
    unemployment  (county, year) float64 99kB 7.9 9.0 5.903 ... 7.018 5.489
    divorce       (county, year) float64 99kB 1.859 2.62 3.747 ... 4.782 7.415
    age           (county, year) float64 99kB 28.8 30.5 34.5 ... 28.97 35.33
Indexes:
county GeometryIndex (crs=None)- county: 3085
- year: 4
- county(county)geometryPOLYGON ((-95.34258270263672 48....
<GeometryArray>
[<POLYGON ((-95.343 48.547, -95.341 48.715, -95.094 48.717, -95.095 48.912, -...>,
 <POLYGON ((-118.851 47.95, -118.847 48.478, -118.869 48.479, -118.87 48.647,...>,
 <POLYGON ((-117.438 48.044, -117.541 48.043, -117.536 47.79, -117.607 47.798...>,
 <POLYGON ((-118.971 47.939, -118.973 47.96, -118.953 47.989, -118.953 48.02,...>,
 <POLYGON ((-117.438 49, -117.031 49, -117.028 48.838, -117.038 48.046, -117....>,
 <POLYGON ((-117.028 48.838, -117.031 49, -116.062 49, -116.056 48.499, -116....>,
 <POLYGON ((-116.054 48.209, -116.056 48.499, -116.062 49, -114.728 49, -114....>,
 <POLYGON ((-113.473 47.598, -113.636 47.6, -113.628 47.652, -113.602 47.669,...>,
 <POLYGON ((-112.182 48.471, -112.228 48.479, -112.583 48.475, -112.587 48.3,...>,
 <POLYGON ((-111.421 48.218, -111.673 48.213, -111.673 48.337, -111.799 48.33...>,
 ...
 <POLYGON ((-76.922 36.554, -76.924 36.554, -77.177 36.556, -77.32 36.554, -7...>,
 <POLYGON ((-79.144 36.546, -79.217 36.55, -79.1 37.056, -79.037 37.03, -79.0...>,
 <POLYGON ((-79.438 37.616, -79.458 37.603, -79.444 37.57, -79.467 37.552, -7...>,
 <POLYGON ((-80.125 37.125, -80.14 37.128, -80.154 37.114, -80.168 37.112, -8...>,
 <POLYGON ((-87.748 44.962, -87.84 44.927, -87.831 44.873, -87.986 44.72, -87...>,
 <POLYGON ((-114.52 33.028, -114.558 33.037, -114.609 33.027, -114.633 33.034...>,
 <POLYGON ((-107.195 34.584, -107.718 34.584, -108.227 34.583, -109.048 34.59...>,
 <POLYGON ((-76.396 37.108, -76.403 37.091, -76.434 37.089, -76.464 37.103, -...>,
 <POLYGON ((-77.532 38.565, -77.721 38.84, -77.707 38.877, -77.678 38.885, -7...>,
 <POLYGON ((-111.372 44.745, -111.368 45.35, -111.349 45.349, -111.349 45.635...>]
Length: 3085, dtype: geometry
- year(year)int641960 1970 1980 1990
array([1960, 1970, 1980, 1990])
- population(county, year)int324304 3987 3764 ... 55800 65077
array([[ 4304, 3987, 3764, 4076], [ 3889, 3655, 5811, 6295], [ 17884, 17405, 28979, 30948], ..., [ 21583, 33203, 44189, 53427], [ 50164, 111102, 166665, 250377], [ 39260, 43766, 55800, 65077]], shape=(3085, 4), dtype=int32) - unemployment(county, year)float647.9 9.0 5.903 ... 5.444 7.018 5.489
array([[ 7.9 , 9. , 5.9025788 , 3.89479009], [ 8.2 , 15.4 , 15.42288557, 16.8115942 ], [10.1 , 9. , 13.57406431, 10.70079408], ..., [ 2.5 , 3.10506508, 5.03704493, 4.1028878 ], [ 3.3 , 2.36155862, 3.70888552, 3.35398107], [ 5.21803859, 5.44429066, 7.01794317, 5.48855304]], shape=(3085, 4)) - divorce(county, year)float641.859 2.62 3.747 ... 4.782 7.415
array([[ 1.85897436, 2.61980831, 3.74659401, 7.38853503], [ 2.86327845, 3.68600683, 6.6254417 , 11.54313487], [ 2.71144662, 2.97637795, 5.44822257, 9.12321222], ..., [ 1.11322292, 1.55032333, 3.25763881, 4.85074627], [ 1.67239146, 1.46834319, 3.74220727, 5.75017712], [ 2.77758585, 2.72460364, 4.78226375, 7.4145588 ]], shape=(3085, 4)) - age(county, year)float6428.8 30.5 34.5 ... 26.4 28.97 35.33
array([[28.8       , 30.5       , 34.5       , 35.5       ],
       [25.9       , 27.1       , 27.2       , 32.8       ],
       [29.6       , 31.8       , 28.7       , 34.5       ],
       ...,
       [24.4       , 24.4       , 29.8       , 34.        ],
       [22.3       , 21.8       , 25.66666667, 28.46666667],
       [28.25      , 26.4       , 28.96666667, 35.33333333]],
      shape=(3085, 4))
- countyGeometryIndex (crs=None)
GeometryIndex(
    [<POLYGON ((-95.343 48.547, -95.341 48.715, -95.094 48.717, -95.095 48.912, -...>
     <POLYGON ((-118.851 47.95, -118.847 48.478, -118.869 48.479, -118.87 48.647,...>
     <POLYGON ((-117.438 48.044, -117.541 48.043, -117.536 47.79, -117.607 47.798...>
     <POLYGON ((-118.971 47.939, -118.973 47.96, -118.953 47.989, -118.953 48.02,...>
     ...
     <POLYGON ((-107.195 34.584, -107.718 34.584, -108.227 34.583, -109.048 34.59...>
     <POLYGON ((-76.396 37.108, -76.403 37.091, -76.434 37.089, -76.464 37.103, -...>
     <POLYGON ((-77.532 38.565, -77.721 38.84, -77.707 38.877, -77.678 38.885, -7...>
     <POLYGON ((-111.372 44.745, -111.368 45.35, -111.349 45.349, -111.349 45.635...>],
    crs=None)
Indexing#
Geometries as labels#
cube.sel(county=cube.county[0])
<xarray.Dataset> Size: 152B
Dimensions:       (year: 4)
Coordinates:
  * year          (year) int64 32B 1960 1970 1980 1990
    county        object 8B POLYGON ((-95.34258270263672 48.54670333862305, -...
Data variables:
    population    (year) int32 16B 4304 3987 3764 4076
    unemployment  (year) float64 32B 7.9 9.0 5.903 3.895
    divorce       (year) float64 32B 1.859 2.62 3.747 7.389
age (year) float64 32B 28.8 30.5 34.5 35.5- year: 4
- year(year)int641960 1970 1980 1990
array([1960, 1970, 1980, 1990])
- county()objectPOLYGON ((-95.34258270263672 48....
array(<POLYGON ((-95.343 48.547, -95.341 48.715, -95.094 48.717, -95.095 48.912, -...>,
      dtype=object)
- population(year)int324304 3987 3764 4076
array([4304, 3987, 3764, 4076], dtype=int32)
- unemployment(year)float647.9 9.0 5.903 3.895
array([7.9 , 9. , 5.9025788 , 3.89479009])
- divorce(year)float641.859 2.62 3.747 7.389
array([1.85897436, 2.61980831, 3.74659401, 7.38853503])
- age(year)float6428.8 30.5 34.5 35.5
array([28.8, 30.5, 34.5, 35.5])
Complex spatial predicates#
Lets index to counties that intersect the provided bounding box
box = shapely.box(-125.4, 40, -120.0, 50)

subset = cube.sel(county=box, method="intersects")
subset
<xarray.Dataset> Size: 8kB
Dimensions:       (county: 63, year: 4)
Coordinates:
  * county        (county) geometry 504B POLYGON ((-121.61367797851562 39.305...
  * year          (year) int64 32B 1960 1970 1980 1990
Data variables:
    population    (county, year) int32 1kB 82030 101969 143851 ... 106701 127780
    unemployment  (county, year) float64 2kB 11.1 9.8 10.53 ... 7.5 9.947 4.811
    divorce       (county, year) float64 2kB 3.455 3.54 5.927 ... 6.056 8.076
    age           (county, year) float64 2kB 33.0 30.5 31.3 ... 27.0 28.6 32.7
Indexes:
county GeometryIndex (crs=None)- county: 63
- year: 4
- county(county)geometryPOLYGON ((-121.61367797851562 39...
<GeometryArray>
[<POLYGON ((-121.614 39.305, -121.896 39.303, -121.881 39.386, -121.869 39.42...>,
 <POLYGON ((-121 39.63, -121.07 39.594, -121.079 39.592, -121.082 39.612, -12...>,
 <POLYGON ((-122.928 39.796, -122.949 39.846, -122.94 39.898, -122.918 39.915...>,
 <POLYGON ((-120.139 39.71, -120.138 39.734, -120.126 39.736, -120.114 39.762...>,
 <POLYGON ((-122.932 39.979, -123.533 39.978, -123.536 39.998, -123.531 40.72...>,
 <POLYGON ((-121.321 40.448, -121.498 40.447, -121.553 40.447, -121.566 40.43...>,
 <POLYGON ((-123.536 39.998, -124.007 39.999, -124.093 40.101, -124.344 40.25...>,
 <POLYGON ((-121.444 41.181, -122.488 41.18, -122.514 41.201, -122.515 41.212...>,
 <POLYGON ((-121.325 41.179, -121.444 41.181, -121.442 41.766, -121.453 41.76...>,
 <POLYGON ((-123.647 41.374, -123.764 41.375, -123.764 41.463, -124.057 41.45...>,
 <POLYGON ((-123.512 41.998, -123.818 41.993, -123.841 42.039, -123.824 42.08...>,
 <POLYGON ((-123.818 41.993, -124.205 41.998, -124.351 42.099, -124.414 42.24...>,
 <POLYGON ((-122.284 42.001, -123.221 42.002, -123.226 42.695, -123.235 42.70...>,
 <POLYGON ((-121.44 41.994, -122.284 42.001, -122.284 42.474, -122.272 42.475...>,
 <POLYGON ((-119.992 41.989, -120.871 41.988, -120.887 42.735, -120.998 42.73...>,
 <POLYGON ((-124.484 42.956, -124.386 43.262, -124.405 43.3, -124.273 43.459,...>,
 <POLYGON ((-123.235 42.702, -123.245 42.701, -123.249 42.723, -123.305 42.72...>,
 <POLYGON ((-122.146 43.436, -122.733 43.434, -122.736 43.534, -123.104 43.53...>,
 <POLYGON ((-122 43.609, -121.974 43.628, -121.984 43.645, -121.966 43.7, -12...>,
 <POLYGON ((-119.656 43.954, -119.776 43.954, -119.774 43.691, -119.892 43.69...>,
 <POLYGON ((-123.199 44.277, -123.194 44.3, -123.223 44.321, -123.235 44.321,...>,
 <POLYGON ((-123.774 44.275, -123.774 44.306, -123.817 44.309, -123.815 44.33...>,
 <POLYGON ((-121.838 44.388, -121.846 44.428, -121.801 44.56, -121.796 44.678...>,
 <POLYGON ((-124.117 44.27, -124.053 44.662, -124.074 44.815, -124.006 45.036...>,
 <POLYGON ((-120.381 44.558, -120.384 44.746, -120.401 44.789, -120.38 44.798...>,
 <POLYGON ((-123.147 44.712, -123.603 44.711, -123.698 44.712, -123.699 44.72...>,
 <POLYGON ((-123.124 44.737, -123.146 44.748, -123.149 44.77, -123.144 44.779...>,
 <POLYGON ((-122.865 45.251, -122.868 45.312, -122.847 45.314, -122.847 45.34...>,
 <POLYGON ((-123.07 45.069, -123.722 45.069, -123.785 45.071, -123.781 45.209...>,
 <POLYGON ((-121.752 44.82, -121.751 44.876, -121.727 44.882, -121.726 44.893...>,
 <POLYGON ((-120.51 45.079, -120.724 45.081, -120.718 45.107, -120.729 45.122...>,
 <POLYGON ((-123.722 45.069, -123.723 45.038, -124.006 45.036, -123.955 45.29...>,
 <POLYGON ((-120.491 45.059, -120.51 45.079, -120.509 45.095, -120.462 45.096...>,
 <POLYGON ((-121.681 45.252, -121.684 45.271, -121.669 45.286, -121.696 45.33...>,
 <POLYGON ((-122.742 45.425, -122.742 45.327, -122.804 45.327, -122.804 45.34...>,
 <POLYGON ((-121.813 45.455, -122.658 45.451, -122.653 45.425, -122.742 45.42...>,
 <POLYGON ((-122.244 45.548, -122.302 45.543, -122.355 45.566, -122.436 45.56...>,
 <POLYGON ((-119.993 45.811, -120.067 45.78, -120.155 45.761, -120.206 45.72,...>,
 <POLYGON ((-122.928 45.714, -122.929 45.729, -122.995 45.729, -122.994 45.74...>,
 <POLYGON ((-121.926 45.642, -121.971 45.636, -121.999 45.618, -122.081 45.59...>,
 <POLYGON ((-123.975 45.776, -123.955 45.871, -123.995 45.942, -123.92 46.012...>,
 <POLYGON ((-122.247 46.057, -122.293 46.054, -122.308 46.043, -122.336 45.95...>,
 <POLYGON ((-123.303 46.145, -123.47 46.275, -123.619 46.259, -123.724 46.286...>,
 <POLYGON ((-123.359 46.375, -123.723 46.38, -123.724 46.286, -123.885 46.241...>,
 <POLYGON ((-121.524 46.384, -121.402 46.387, -121.387 46.409, -121.453 46.51...>,
 <POLYGON ((-123.372 46.793, -123.16 46.792, -123.158 46.76, -122.23 46.762, ...>,
 <POLYGON ((-122.23 46.762, -123.158 46.76, -123.16 46.792, -123.163 46.993, ...>,
 <MULTIPOLYGON (((-122.801 47.361, -122.798 47.399, -122.636 47.399, -122.74 ...>,
 <POLYGON ((-123.16 46.792, -123.372 46.793, -124.101 46.79, -124.138 46.9, -...>,
 <POLYGON ((-121.381 47.07, -121.385 47.088, -121.404 47.113, -121.381 47.14,...>,
 <POLYGON ((-119.453 46.676, -119.468 46.704, -119.512 46.721, -119.624 46.64...>,
 <POLYGON ((-123.08 47.09, -123.084 47.077, -123.205 47.078, -123.485 47.079,...>,
 <POLYGON ((-121.385 47.088, -121.442 47.085, -121.512 47.124, -121.577 47.11...>,
 <POLYGON ((-122.636 47.399, -122.798 47.399, -122.802 47.518, -123.025 47.51...>,
 <POLYGON ((-120.004 47.221, -120.069 47.225, -120.09 47.257, -120.074 47.319...>,
 <POLYGON ((-122.924 48.067, -122.84 48.133, -122.768 48.144, -122.802 48.086...>,
 <POLYGON ((-121.117 47.597, -121.124 47.644, -121.116 47.671, -121.065 47.70...>,
 <POLYGON ((-121.118 47.776, -122.393 47.774, -122.302 47.95, -122.229 47.969...>,
 <POLYGON ((-124.605 47.874, -124.731 48.15, -124.704 48.232, -124.716 48.378...>,
 <MULTIPOLYGON (((-122.732 48.277, -122.664 48.397, -122.603 48.405, -122.524...>,
 <POLYGON ((-118.971 47.939, -118.973 47.96, -118.953 47.989, -118.953 48.02,...>,
 <POLYGON ((-122.377 48.29, -122.563 48.414, -122.666 48.413, -122.698 48.495...>,
 <POLYGON ((-120.856 49, -120.856 48.981, -120.875 48.97, -120.873 48.962, -1...>]
Length: 63, dtype: geometry
- year(year)int641960 1970 1980 1990
array([1960, 1970, 1980, 1990])
- population(county, year)int3282030 101969 ... 106701 127780
array([[ 82030, 101969, 143851, 182120], [ 11620, 11707, 17340, 19739], [ 25305, 29517, 38888, 49625], [ 13597, 16796, 21661, 27598], [ 9706, 7615, 11858, 13063], [ 59468, 77640, 115715, 147036], [ 104892, 99692, 108514, 119118], [ 32885, 33225, 39732, 43531], [ 8308, 7469, 8610, 9678], [ 17771, 14580, 18217, 23460], [ 29917, 35746, 58855, 62649], [ 13983, 13006, 16992, 19327], [ 73962, 94533, 132456, 146389], [ 47475, 50021, 59117, 57702], [ 7158, 6343, 7532, 7186], [ 54955, 56515, 64047, 60273], [ 68458, 71743, 93748, 94649], [ 162890, 215401, 275226, 282912], [ 23100, 30442, 62142, 74958], [ 9430, 9985, 13091, 14111], ... [ 14674, 15796, 17237, 18882], [ 145112, 145212, 172508, 188823], [ 41858, 45467, 56025, 59358], [ 55049, 76894, 124264, 161238], [ 321590, 412344, 485643, 586203], [ 54465, 59553, 66314, 64175], [ 20467, 25039, 24877, 26725], [ 46477, 41881, 48522, 54758], [ 16251, 20918, 31184, 38341], [ 935014, 1159369, 1269749, 1507319], [ 84176, 101732, 147152, 189731], [ 14890, 16787, 22144, 26205], [ 9639, 10661, 15965, 20146], [ 40744, 41103, 45061, 52250], [ 172199, 265236, 337720, 465642], [ 30022, 34770, 51648, 56464], [ 19638, 27011, 44048, 60195], [ 25520, 25867, 30639, 33350], [ 51350, 52381, 64138, 79555], [ 70317, 81983, 106701, 127780]], dtype=int32) - unemployment(county, year)float6411.1 9.8 10.53 ... 7.5 9.947 4.811
array([[11.1 , 9.8 , 10.53133629, 9.52143887], [12. , 11.5 , 16.87386687, 8.21933962], [ 7.7 , 9.1 , 11.65809769, 10.27671947], [12.4 , 11.5 , 13.6199095 , 9.3954918 ], [13.1 , 13.6 , 17.58429364, 8.15996768], [10.7 , 12.1 , 13.82450671, 8.75843055], [ 7.5 , 10.6 , 12.18795289, 8.59049058], [ 7.8 , 10.1 , 13.49808767, 9.37294092], [ 7.1 , 5.7 , 7.46066196, 10.57424741], [ 8.1 , 10.1 , 15.51389787, 10.93732291], [10.3 , 9.7 , 14.1063483 , 10.38546812], [ 7.2 , 10.1 , 10.63060457, 4.6185781 ], [ 6.9 , 8.8 , 11.56086147, 7.42474126], [ 7.1 , 6.9 , 12.54152824, 10.03957985], [ 9. , 8.4 , 9.51164111, 8.22036343], [ 5.9 , 7.5 , 11.41449025, 9.17424066], [ 7.4 , 8.9 , 10.99166412, 8.59217524], [ 6.1 , 8.1 , 10.13996985, 7.13303738], [ 8.9 , 6.7 , 11.09119117, 4.91342508], [10.3 , 7.6 , 13.47382968, 6.88094867], ... [ 6.6 , 6.9 , 10.04636785, 6.83760684], [10.2 , 9.2 , 9.19008179, 9.81091604], [ 6.9 , 6.9 , 8.77451831, 8.04647329], [ 5.9 , 5.7 , 7.93355994, 6.89956659], [ 6.6 , 8.4 , 8.55857441, 6.43604452], [ 8.1 , 9.7 , 10.73526363, 9.34096569], [ 8.2 , 10.1 , 9.53302017, 7.08476697], [ 6.4 , 5.3 , 8.89458446, 7.80144778], [ 7. , 7.9 , 8.79103022, 6.97796089], [ 5.5 , 8.1 , 5.37555589, 4.14551895], [ 6.5 , 7.2 , 7.58522161, 6.44668065], [ 6.4 , 7.9 , 9.37409306, 8.25861255], [ 5.4 , 6.8 , 10.41412911, 7.20426202], [ 8.3 , 10.7 , 10.47081676, 7.88451528], [ 7.3 , 8.7 , 6.9690554 , 4.14831981], [ 5.9 , 7.5 , 10.31431468, 8.0075801 ], [ 7.2 , 10. , 9.92799778, 5.9188375 ], [ 7.5 , 10.5 , 12.70019458, 10.2035439 ], [ 8.6 , 8.4 , 10.98384201, 5.79514081], [ 8.3 , 7.5 , 9.94658055, 4.81064641]]) - divorce(county, year)float643.455 3.54 5.927 ... 6.056 8.076
array([[ 3.45455158, 3.53982301, 5.92681975, 8.31554683], [ 4.94218998, 4.64810349, 6.84024713, 9.5681848 ], [ 3.35659688, 3.68728782, 6.11637348, 9.0869683 ], [ 4.33306709, 4.09246575, 7.95193883, 7.1417648 ], [ 5.40467137, 5.11073254, 7.29567822, 11.23857671], [ 3.89026955, 4.41601619, 7.58684576, 10.06529438], [ 4.26799412, 4.50921309, 7.71323598, 9.95779853], [ 4.28059896, 4.34919387, 6.69887699, 9.66715614], [ 3.83091149, 3.5841022 , 6.09090909, 8.99653979], [ 4.2466645 , 3.74169041, 8.69503546, 9.37942187], [ 3.56476297, 3.91231542, 6.87932536, 10.30531159], [ 4.22984836, 4.82716302, 6.88271146, 10.66326531], [ 4.66902628, 4.79035037, 8.06630053, 10.54480287], [ 4.09887899, 4.07247074, 7.33131295, 9.59398095], [ 4.39061317, 4.40565254, 6.84174153, 8.6622807 ], [ 3.99081851, 4.04010761, 7.05673466, 10.73504715], [ 3.70747002, 4.09103224, 6.60891515, 9.73576728], [ 2.71321981, 3.26218492, 7.2391774 , 9.68241458], [ 3.10230211, 3.33002437, 6.98814701, 9.43533319], [ 3.54545455, 4.76320832, 6.83899858, 10.00557932], ... [ 3.64882386, 4.16666667, 7.31058928, 10.10415258], [ 2.85370185, 3.67647059, 5.98687851, 8.0425878 ], [ 2.69514873, 3.56540593, 5.90175064, 9.34145898], [ 3.15108068, 3.43659245, 7.13894788, 9.48731279], [ 3.64909632, 3.75109781, 6.87019641, 9.56513524], [ 3.8317093 , 4.58029281, 7.95806528, 10.96678724], [ 2.80876755, 2.41804937, 5.60700624, 7.25680037], [ 2.83571744, 3.15446713, 5.4959186 , 7.98870784], [ 3.1964255 , 4.50604469, 8.00253546, 9.91508651], [ 3.88684008, 4.62416714, 8.04859072, 9.65491244], [ 3.58601044, 3.59937801, 7.03175015, 8.84316739], [ 2.41903239, 2.72637145, 5.5119062 , 8.03148017], [ 4.01561629, 5.13494149, 8.28216029, 11.56156156], [ 3.36293085, 4.13906199, 6.35066728, 9.35284818], [ 3.10868412, 3.75236574, 7.25083432, 9.70933227], [ 3.78298579, 3.65268534, 6.71675659, 9.85877241], [ 2.34611836, 2.96346025, 5.08762974, 6.44647018], [ 3.37204109, 4.09038602, 7.12233348, 9.24562653], [ 3.88397247, 3.73231717, 6.75234514, 9.43039862], [ 2.71648921, 3.00724397, 6.05597714, 8.07628626]]) - age(county, year)float6433.0 30.5 31.3 ... 27.0 28.6 32.7
array([[33. , 30.5, 31.3, 33.8],
       [32.5, 34.6, 32.6, 39. ],
       [29.9, 30.1, 33.4, 36. ],
       [31.4, 30.6, 29.1, 31.9],
       [29.3, 32.1, 32.7, 37.8],
       [28.9, 28.8, 31.2, 34.9],
       [26.7, 27.1, 29.2, 33.1],
       [32.4, 32.7, 32.4, 37.3],
       [31.3, 33.3, 33.8, 37.2],
       [25.9, 29.2, 31. , 32.3],
       [33.1, 35.6, 33.7, 39.9],
       [28.2, 31.8, 37. , 44. ],
       [31.8, 31. , 31.3, 36.7],
       [28.2, 28.1, 29.8, 34.9],
       [29.8, 31.6, 31.2, 36.3],
       [27.8, 29.1, 31.4, 37.6],
       [27.1, 28.8, 30.2, 36. ],
       [27. , 26.3, 28.8, 33.9],
       [31.7, 31. , 29.9, 35.9],
       [28.3, 30.4, 32. , 35.8],
...
       [35.4, 35.8, 35.9, 40.3],
       [27.9, 28.7, 29.6, 31.5],
       [33.4, 31.7, 31.2, 34.9],
       [29.3, 28.4, 29.6, 33.7],
       [28.1, 24.8, 28.2, 31.3],
       [32.4, 30.4, 30.9, 35.4],
       [29.3, 23.5, 27.7, 30.2],
       [23.5, 25.2, 28.8, 31.9],
       [32.2, 31.1, 32.5, 36.9],
       [30.6, 28.5, 30.8, 33.7],
       [30.6, 28.7, 29.3, 31.8],
       [27.2, 29.1, 30.4, 33.5],
       [30.5, 33.8, 35. , 41.1],
       [31.7, 32.5, 33.2, 35.1],
       [27.8, 26.1, 29.3, 32.2],
       [30.1, 31.7, 31.7, 38.4],
       [24. , 25.5, 29.3, 32.2],
       [29.4, 31.1, 31.2, 35. ],
       [32. , 31.7, 32. , 35.6],
       [31.3, 27. , 28.6, 32.7]])
- countyGeometryIndex (crs=None)
GeometryIndex(
    [<POLYGON ((-121.614 39.305, -121.896 39.303, -121.881 39.386, -121.869 39.42...>
     <POLYGON ((-121 39.63, -121.07 39.594, -121.079 39.592, -121.082 39.612, -12...>
     <POLYGON ((-122.928 39.796, -122.949 39.846, -122.94 39.898, -122.918 39.915...>
     <POLYGON ((-120.139 39.71, -120.138 39.734, -120.126 39.736, -120.114 39.762...>
     ...
     <MULTIPOLYGON (((-122.732 48.277, -122.664 48.397, -122.603 48.405, -122.524...>
     <POLYGON ((-118.971 47.939, -118.973 47.96, -118.953 47.989, -118.953 48.02,...>
     <POLYGON ((-122.377 48.29, -122.563 48.414, -122.666 48.413, -122.698 48.495...>
     <POLYGON ((-120.856 49, -120.856 48.981, -120.875 48.97, -120.873 48.962, -1...>],
    crs=None)
Show code cell source
Hide code cell source
f, axes = subset.population.xvec.plot(col="year", robust=True)
for ax in axes.flat:
    ax.plot(*box.boundary.xy, color='w')
    ax.plot(*box.boundary.xy, color='k', lw=0.75)
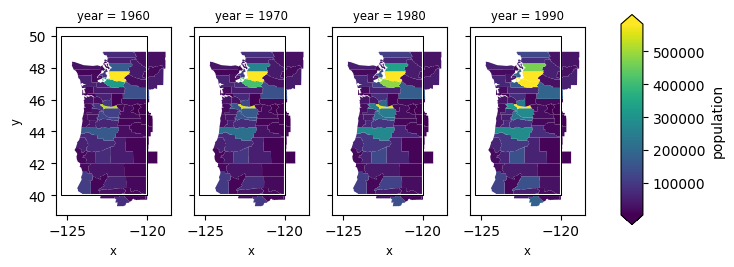
Notice how we did that with xarray.DataArray.sel()?!